Cycling Findings #3
Interesting research from the cycling science literature
Aerodynamic drag in cycling team time trials Blocken et al., 2018
Technology has always been an integral part of cycling. Obviously, bicycles are themselves technology, and also rely on technology (i.e. good quality road surfaces) to be a practical means of transportation. Cycling has also taken its fair share of the spoils obtained from the increase in the rate of technological development of recent years; innovations such as carbon fibre, power meters, and GPS computers (amongst many others) have transformed cycling at every level.
Technological innovations are also helping push forward our knowledge of the physics of cycling, and a great deal of this progress has come from the study of aerodynamics. Field tests and wind tunnels were a starting point, subsequently complemented by computational fluid dynamics (CFD), which utilizes modern information-processing capabilities to simulate highly complex physical situations in a much more comprehensive way than the relatively two-dimensional analysis possible in a wind tunnel.
The importance of aerodynamics is readily apparent to all road cyclists, especially those who have ridden at speed in a group. It's been known for decades that the energy saving obtained from riding immediately behind another rider (or other vehicle) is very large, and it has recently been shown that in a very large peloton the aerodynamic drag of a rider near the back centre of the group can be reduced to below 10% of that experienced by an individual cyclist.
The work outlined here utilized wind tunnel measurements and 3-dimensional CFD simulations to study drafting of up to 9 cyclists riding in single-file formation at various distances. Much of the work consisted of designing and validating CFD simulations. We won't get into the theoretical concerns (although aerodynamics is a fascinating subject, it gets extremely complicated very quickly); suffice it to say that the CFD simulations aligned very closely with wind tunnel measurements, and that reasonable assumptions regarding rider and bicycle geometry were made. All results used a velocity of 15 m/s (54 km/h, 33.5 mph), at which speed aerodynamic drag accounts for 90% of the total drag forces on a rider; for lower speeds this figure would be less, and the magnitude of the energy savings indicated would be smaller.
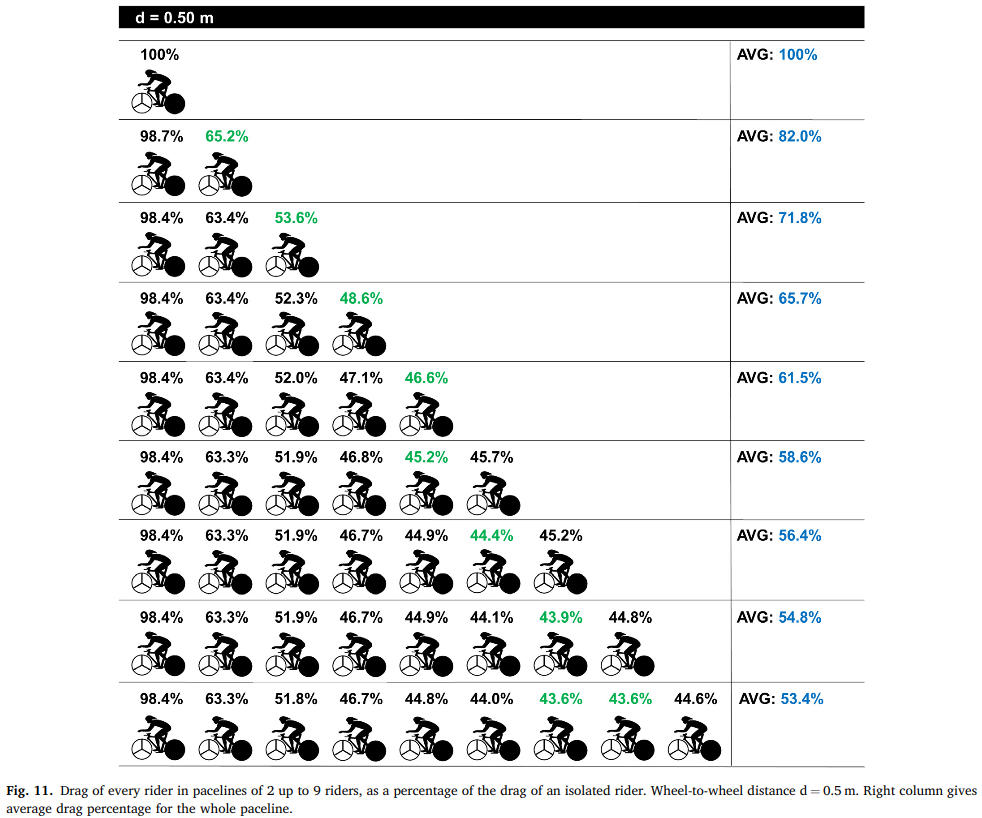
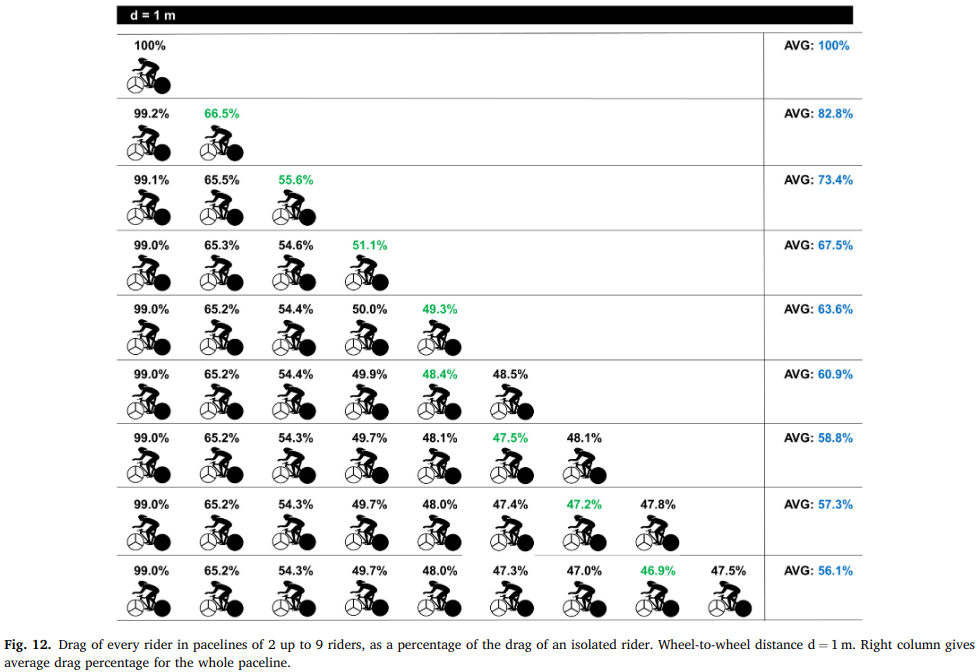
The main results are shown in the following figures (identical pacelines except for the inter-rider distances, which are 15 cm, 50 cm and 1 m respectively).
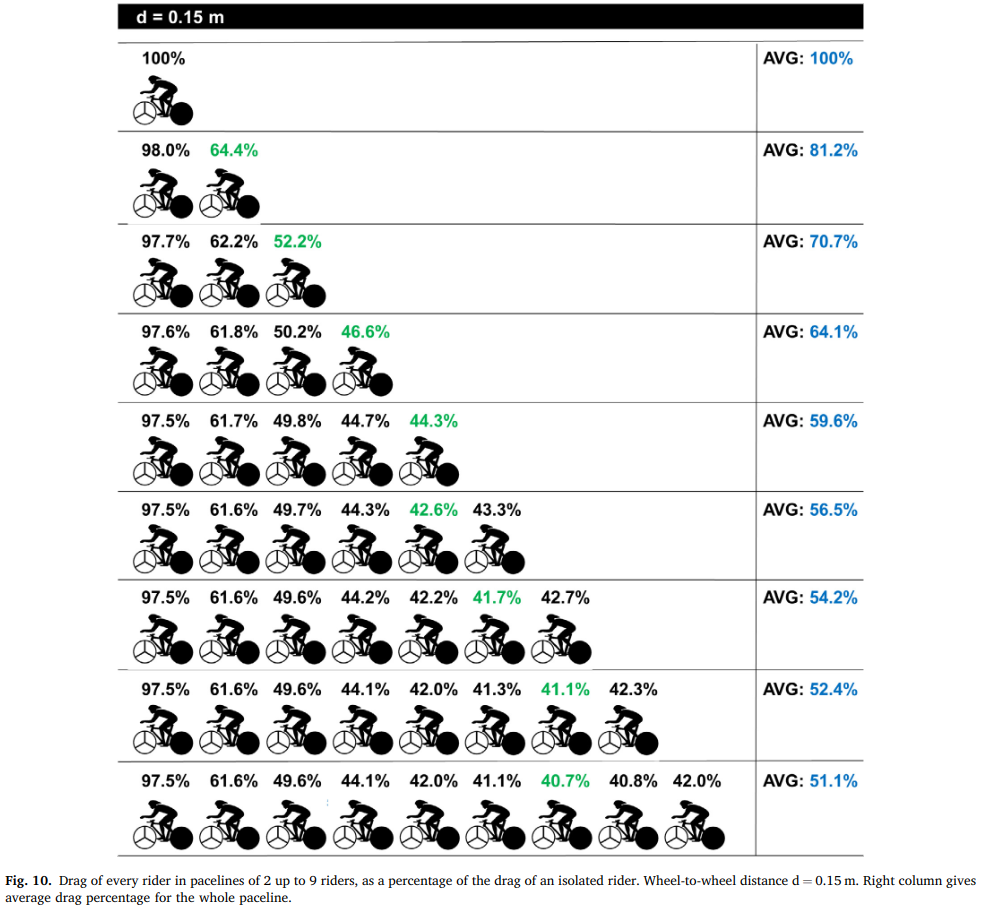
Distances of 5 cm and 5 m were also modelled, but aren't shown here (5 cm is unrealistically close, while 5 m is far larger than found in all but the most disorganized groups1).
Interesting points to note include:
1) the lead rider in a group receives a small aerodynamic benefit compared to riding solo (due to upstream disturbance, i.e. following riders 'pushing' air forward);
2) upstream disturbance also means that the rider experiencing the greatest drag reduction is not the last rider for groups with six or more members;
3) riding second in a paceline reduces drag to 60-70%, and riding third to 50-60%, compared with an isolated rider. Beyond fourth place in a long paceline, however, additional benefits are much smaller. But remember that this analysis is for a single line of riders; as noted above a large, multi-column peloton reduces drag even more, since it produces a much larger wake from multiple lead riders.
The most illuminating point to me, though, was how little difference there is between the three distances shown in the charts: the middle rider of a 5-man group, for example, experiences 50%, 52% and 54% of the drag of an isolated rider at 15 cm, 50 cm or 1 m, respectively.
Although this is certainly significant for a team time trial or pursuit race, for amateur riders, even when racing, I'd suggest that the 2% reduction of drag when going from 50 cm to 15 cm isn't worth the additional risk of a crash: if the lead rider is doing 400 Watts this difference amounts to just 8 Watts2, but 15 cm (6 inches) gives you almost zero reaction time, whilst 50 cm (over two-thirds of a wheel length) allows much more room to manoeuvre. In practice you might be somewhere in between these two distances, but the main message is not to worry about squeezing out every last centimetre, especially in a situation with unknown riders on a technical course.
To conclude with a personal anecdote: on my most recent group ride there was a 15-minute period where I rode in a 3-man line, during which I averaged 240 Watts and the group as a whole maintained a steady pace with evenly-spaced changes every 90 seconds or so. We know and trust each other quite well, so kept the gaps small. My average power during this period was as follows: on the front 320 W, on the back 180 W (56%) and in second 210 W (66%). These numbers are remarkably close to those shown in the charts. Each of us could probably keep up a 240 Watt average for two or three hours of riding, but wouldn't last more than a few minutes at 320 Watts.
That's the power of drafting.
1 although even gaps this large still produced substantial beneficial effects.
2 actually even less, because to keep things simple I'm crudely (and incorrectly) assuming that aerodynamic drag is the only force acting against cyclists.